Interactive Gantt timeline for Jira
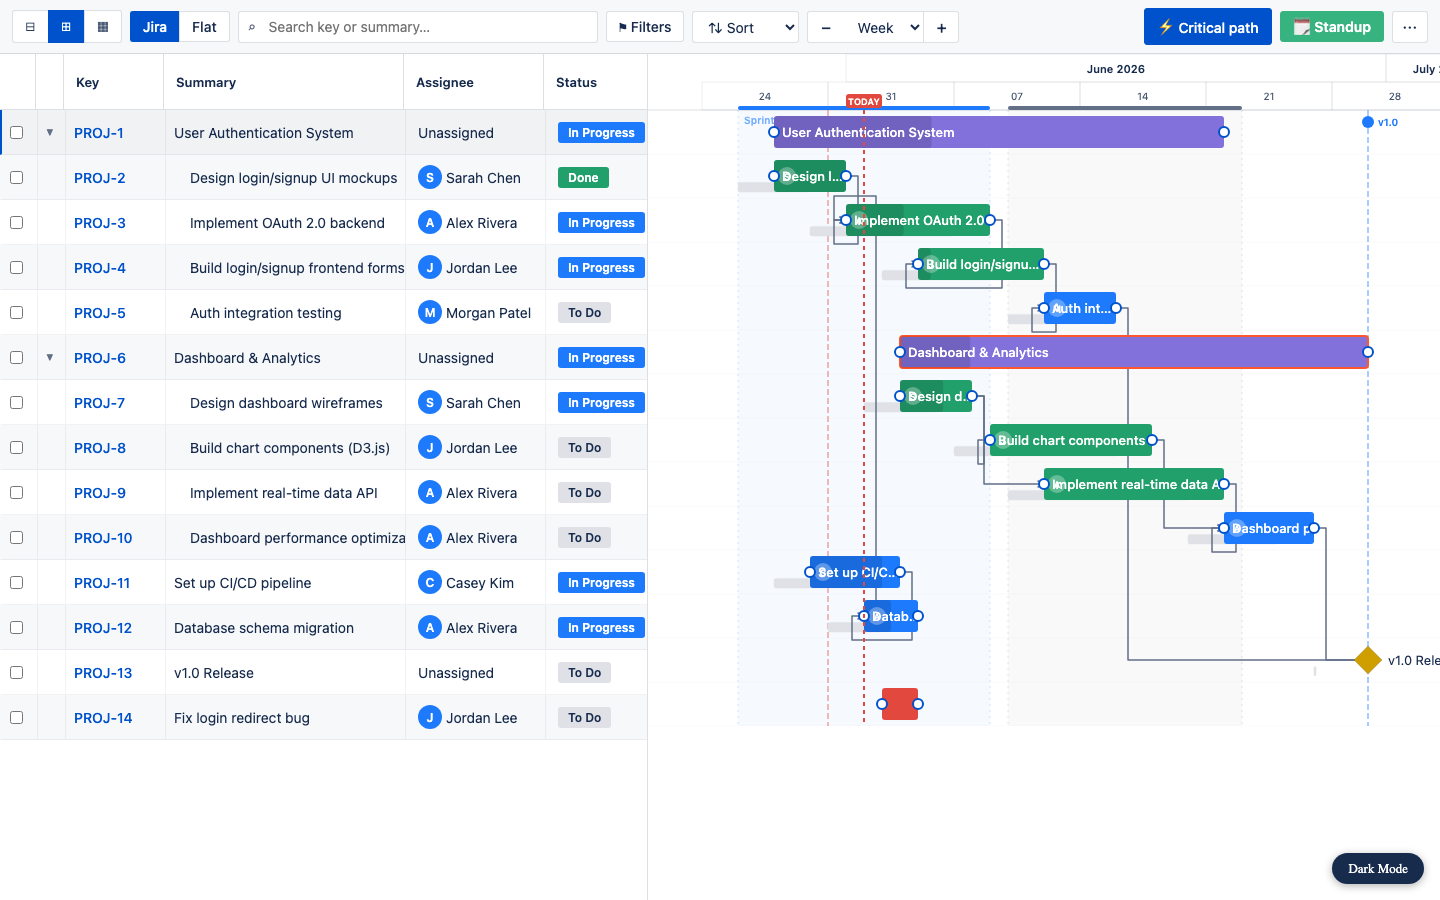
GanttBoard draws every Jira issue with a Start and Due date as a bar on a horizontal timeline. Drag a bar to move it and both dates shift together; drag its right edge to change duration. Every change writes straight back to the Jira issue — there is no separate database, your Jira data stays the source of truth.
- Zoom across four levels, from Day to Quarter.
- A red TODAY line runs down the whole chart.
- Zero-duration issues render as milestone diamonds.
- A live ghost preview shows exactly where a bar will land while you drag it.